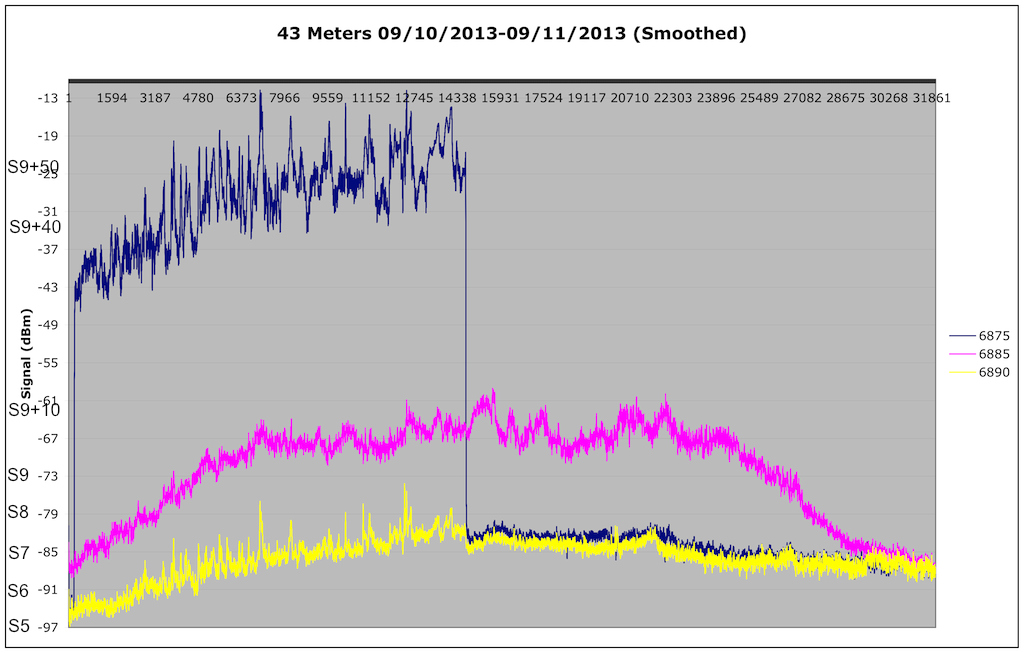
The follow graph is the signal strength on three frequencies, from 2055 UTC on 10 September 2013 to 0545 UTC on 11 September 2013:
(Click on the image to see a larger version)
The X axis scale at the top of the graph is seconds since the recording started (2055 UTC)
The Y axis scale is the signal strength in dBm. I’ve marked off several corresponding S meter readings for easy comparison.
I’ve smoothed out the signal readings with a low pass filter, to make the general trends easier to see.
6875 kHz is used by WWCR, which you can see signed on at 2100 UTC, and signed off at 0100 UTC. It has a transmitter power of 100 kW, and is located approximately 700 miles to my southwest.
6885 kHz is used by Galei Zahal, Israeli army radio, which has a power of 5 kW. It is approximately 5800 miles away.
6890 kHz had no station, and was recorded to show how the background noise levels varied.
Local sunset here was 2322 UTC, which is at about 9300 on the X axis.
Several things can be observed:
The signal strength of both WWCR and Galei Zahal steadily increased until local sunset. This is likely due to the D layer of the ionosphere recombining, which means it causes less attenuation to the radio signals.
Likewise, the background noise level also increased over this time period, from about S5 to a little over S7.
You can also observe Galei Zahal fade out as the Sun began to rise in Israel.
WWCR had a strong signal, but there was considerable variability, about 3 S units worth.
WWCR is within the range of where you expect to find most pirate stations in the Northeast USA (Guise Faux’s famous 500 miles around Pittsburgh). We can extrapolate how strong it would be at lower power levels, in the range most pirates use. We can also take into account the high gain provided by their antennas, as their characteristics are provided at the FCC. They claim 14 dB. I’ll assume that I am likely in their main beam.
The signal level of WWCR is about -25 dBm during the peak signal period. Adjusting for the antenna gain, we can reduce it to -39 dBm.
We can further adjust for the power level. If instead of 100 kW it was 100 watts, we would expect the signal to be about 30 dB less (a power factor of 1000 is equal to 30 dB), So that would be -69 dBm, just a bit above S9, which is -73 dBm.
At 30 watts, we’d expect 5 dB less, or -74 dBm, very close to S9.
At 10 watts, our standard grenade power level, we’d expect a signal of -79 dBm, which is close to S8.
These signal levels seem reasonable, based on signal levels I have observed, when the operator gave their transmitter power.
Observe from the graph that the background noise levels were about S7 during the time period. So a 10 watt signal would be about an S unit above noise, or barely audible at this distance, 700 miles. At 30 watts, you’d be about 2 S units above noise, and somewhat easier to hear. 100 watts would be almost 3 S units above noise.
For fun, we can do the same with the Galei Zahal transmitter power. I know nothing about their antenna setup, so we can’t compensate for that. Their signal was about – 67 dBm, once it got dark. Reducing the 5 kW transmitter power to 100 watts reduces the signal by 17 dB, or down to -84 dBm, which is S7. So it would be barely audible. Europirates in the 100 watt range are heard well here, but that part of Europe is much closer, so that’s to be expected.
Much of the background noise is static from thunderstorms. Once we get into late fall and winter, storm activity levels are much less, and the noise level should go down.