Ionosonde
From HFUnderground
An ionosonde or ionospheric sounder (colloq. chirpsounder), is a specialized radar system for the examination of the ionosphere. An ionosonde is used for finding the optimum operation frequencies for broadcasts or two-way communications in the high frequency range.(1)
Contents |
Description
Ionospheric reflection of radio waves was discovered in 1924 by Edward Victor Appleton. The basic ionosonde technology was invented in 1925 by Gregory Breit and Merle A. Tuve (2) (3) and further developed in the late 1920s by a number of prominent physicists, including E. V. Appleton. The term ionosphere and, hence, the etymology of its derivatives, was proposed by Robert Watson-Watt.
An ionosonde consists of:
- A high frequency (HF) transmitter, automatically tunable over a wide range. Typically the frequency coverage is 0.5–23 MHz or 1–40 MHz, though normally sweeps are confined to approximately 1.6–12 MHz.
- A tracking HF receiver which can automatically track the frequency of the transmitter.
- An antenna with a suitable radiation pattern, which transmits well vertically upwards and is efficient over the whole frequency range used.
- Digital control and data analysis circuits.
The transmitter sweeps all or part of the HF frequency range, transmitting short pulses. These pulses are reflected at various layers of the ionosphere, at heights of 100–400 km, and their echos are received by the receiver and analyzed by the control system. The result is displayed in the form of an ionogram.
Modern ionosondes, like the popular Lowell DIGISONDE(TM), use low power transmitters but compensate by using specialized DSP techniques in the receiver. The result is a portable instrument, which can be easily relocated to interesting HF communications sites.
Operation
As the transmitted frequency increases, the radio wave is refracted less by the ionisation in the layer, and so it penetrates further before it is eventually reflected. As the wave approaches the reflection height, its group velocity approaches zero and this increases the time-of-flight of the signal. Eventually, a frequency is reached that enables the wave to penetrate the layer without being reflected. For ordinary mode waves, this occurs when the transmitted frequency (fo) just exceeds the peak plasma frequency of the layer. These frequencies are identified by the layer where reflection takes place (foE, foF1, foF2 and foEs). In the case of the extraordinary wave, the magnetic field of the earth enhances the reflection capability of the ionosphere and reflection occurs at a frequency (fx) that is higher than the ordinary wave by half the electron gyrofrequency.
The frequency Fc at which a wave just penetrates a layer of ionisation is known as the critical frequency of that layer. The critical frequency is related to the electron density in the specific layer (D, E, F1 or F2).
All transmitted frequencies above this critical frequency will penetrate the layer without being reflected. Their group velocity, however, will be slowed by any ionisation, and this will add to the time-of-flight. If such a wave encounters another layer whose plasma frequency is higher than the frequency of the wave, it will be reflected, and the return signal will be further delayed as it travels back through the underlying ionisation. Therefore, HF frequencies between 5 and 30 MHz pass through the E layer and are reflected at the F layer. Similarly, MF frequencies (AM broadcast stations) at night pass through the D layer and are reflected by the E layer. When a sporadic E cloud passes over the ionosonde, then foEs becomes very high, often exceeding 25 MHz. This high reflection frequency allows medium distance ionospheric communications and TV DX reception in the low VHF range (28, 50 and even 70 MHz) with very strong signal stengths.
Ionogram
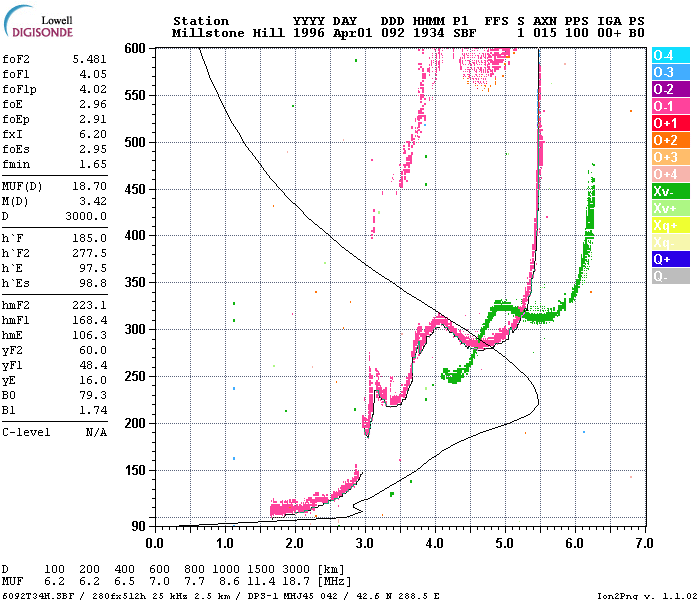
An ionogram is a display of the data produced by the ionosonde. It is a graph of the virtual height of the ionosphere plotted against frequency. Ionograms are often converted into electron density profiles. Data from ionograms may be used to measure changes in the Earth's ionosphere due to space weather events.
The maximum usable frequency (MUF) for radio waves transmitted at a low angle over the horizon is approximate 3 times the highest frequency returned to the ionosonde from radio waves transmitted directly upwards (to the zenith of the location). Therefore, in the sample ionogram shown above, fxI was measured as 6.2 MHz (green dataset), and the MUF for ionospheric reflection at the area of the ionosonde was calculated as 18.7 MHz for a hop distance of 3000 km. The pink dataset, which represents the ordinary wave, shows reflections at approximately 3 MHz (E-layer) and 5.5 MHz (F-layer).
The HAARP digisonde
This paragraph consists of Public domain material from the HAARP website
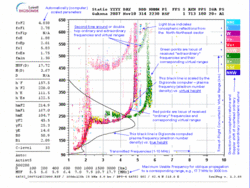
The HAARP Digisonde, which was developed and provided by the University of Massachusetts at Lowell, was one of the first instruments installed at the HAARP Research Station. The purposes of this instrument are to support frequency management of the 3600 kW Ionospheric Research Instrument transmitter and to provide real time ionospheric characteristics for guiding experiment selection. The Digisonde data are processed, archived, and are available for post-analysis of experiment results. Various formats of the information derived from the Digisonde are made available on the HAARP web site in chart form in near real time and can be accessed from the Data Index.
An example, annotated ionogram is shown in the figure to the left. Annotations in this figure are in blue lettering. (Click on the figure to see a full size image.)
This ionogram shows a well-formed F-Layer with a peak ionization at around 220 km. There is also a less obvious E-Layer at an altitude of about 110 km. The ionogram clearly shows how the transmitted digisonde signal splits into reflected ordinary and extraordinary waves. The ionogram chart and the parameter FoF2 in the list on the left side of the chart, show that the highest frequency that will be reflected from the ionosphere for vertical incidence (ie., for a radio wave traveling straight up from the ground) is 4.8 MHz.
The ionogram also shows what appear to be faint reflections from an altitude of 425 km. In reality, these chart points are the result of the sounder's radar signal being reflected by the ionosphere, returning to the ground where they are reflected back to the ionosphere for a second reflection before being detected by the Digisonde receiver. The time-of-flight is, therefore twice that of the normal reflection and the computed virtual height is twice the normal virtual height. This type of presentation is often seen under conditions of low ionospheric absorption.
Digisonde operating modes (5)
- Scanning ionogram: This is the basic mode, which results in the production of a standard ionogram. The system steps through frequencies according to the selected program, transmitting and coherently integrating a stream of N pulses. Prior to transmission on each frequency, four possible operating frequencies are monitored for interference and occupancy and the quietest is selected for the measurement. Then a few trial pulses are transmitted to allow automatic adjustment of receiver gain. As each coherent integration of pulse streams in completed, the raw output (i.e. 128 color coded amplitudes representing echoes at 128 heights) is added to the display of the developing ionogram. After all frequency steps have been completed the raw ionogram (16 complex Doppler lines at 256 heights and M frequency steps) is written out to a disk file. ARTIST, the automatic scaling program (Automatic Real-Time Ionogram Scaler with True height analysis), is invoked and a file of automatically scaled parameters is created and displayed.
- Fixed frequency ionogram: This is the same as a scanning ionogram except that the operating frequency remains the same, and no ionogram scaling is attempted.
- High resolution Doppler ionogram: Technically all Digisonde ionograms are Doppler ionograms since multiple Doppler lines (i.e. a Doppler spectrum) are created by the spectral domain integration for each range sampled. However, the pulse repetition rate is too rapid and the number of Doppler lines too few to adequately analyze Doppler spread. In order to get the optimum Doppler range and resolution for such an analysis the total integration period should be tens of seconds, therefore modes were developed which multiplex the coherent integration of echoes at several frequency steps simultaneously by switching frequencies between pulses.(4)
- Drift ionogram: This is similar to the Doppler Ionogram in that higher Doppler resolution is achieved by extending the integration period. In addition to multiplexing frequencies the receive antennas are also multiplexed. This provides a raw data file which records the relative phase of all Doppler lines of all echoes on the four antennas in the receiver array, giving the angle of arrival of the individual echoes.
- Oblique ionogram: This is the same as a Scanning Ionogram and results in a raw data display and disk file.
See also
References
- The term ionosonde was also used in the past to describe a balloon-borne upper atmospheric research device, used in determining the amount of ionizing radiation in the atmosphere caused primarily by nuclear testing. See H. Odishaw: "Glossary", Bulletin of the Atomic Scientists, May 1961, pp. 257. Also Ionosonde Yahoo group.
- F.C. Judd, G2BCX: "Radio Wave Propagation (HF Bands)", Heinemann, London, ISBN 0-434-90926-2, 1987, pages 12–20,27–37
- G. Jacobs, W3ASK, T.J. Cohen, N4XX and R.B. Rose, K6GKU: "The new Shortwave Propagation Handbook", CQ Communications, Inc., ISBN 0-943016-11-8, 1995, pages 1-2 to 1-5.
- Zhigang Yuan, Baiqi Ning, Weixing Wan, Hong Yuan: "Acquirement and analysis of Doppler ionograms with high accuracy in the ionogram mode from Digisonde 256", Radio Science, 39, RS2021, 2004.
- NOAA: "Digisonde DPS4 Operations Manual", 2007.
Further reading
- Gwyn Williams, G4FKH: "Interpreting Digital Ionograms", RadCom, Radio Society of Great Britain, 85(05), May 2009, pp. 44-46.
- Breit, G. and Tuve, M.A.: "A Test of the Existence of the Conducting Layer", Physical Review, 28(3), 1926, pp. 554-575.
- Appleton, E. V.: "The Timing of Wireless Echoes, the use of television and picture transmission", Wireless World, 14, January 1931, pp. 43-44
- The UK Ionospheric Monitoring Group
- NOAA Ionosonde portal to information and data services
- NOAA Dynasonde: Real-time Ionospheric Explorer by advanced and prototype analysis methods.
- http://aintel.bi.ehu.es/chirps-data/chirps.html
- Lowell Center for Atmospheric Research, MA, USA
- Ionosonde (partial) station list by location
- National Observatoy of Athens, Greece
- Canadian Advanced Digital Ionosonde (CADI)
| | This article contains textual material from Wikipedia (TM). Wikipedia texts are licensed under the Creative Commons Attribution-Share Alike license. In short: you are free to distribute and modify the text as long as you attribute its author(s) or licensor(s). If you alter, transform, or build upon this work, you may distribute the resulting work only under the same or similar license to this one. Wikipedia article: Ionosonde | WP |
This site is a participant in the Amazon Services LLC Associates Program, an affiliate advertising program designed to provide a means for sites to earn advertising fees by advertising and linking to Amazon.com. Some links may be affiliate links. We may get paid if you buy something or take an action after clicking one of these.


